Trends In Patent Regime Of India From 2012-17: An Efficient Era?
The Indian government has tried to strengthen the patent regime in India over the last few years. An Intellectual Property Rights (“IPR”) friendly regime is important for attracting foreign investors and companies. It also promotes the growth of innovation by both domestic entrepreneurs and start-ups across all industries. Globally, India is presently Rank 14 in Patent filing activity by origin while China has consistently stayed in Rank 1 position. This article analyses the trends in the patent regime of India from 2012 to 2017. The main source of information is the Annual Reports released by the Office of the Controller General of Patents, Designs, Trademarks, and Geographical Indications (“Patent Office”).
i. Trends In Patents From 2012-2017
The filing of patent applications has remained more or less the same with just a 4% increase from 2012-13 (from 43,674 applications filed in 2012-13 to 45,444 applications files in 2016-17). However, while the number of applications filed decreased by 3% from 2015-16 (46,904 applications) to 2016-17 (45,444 applications), the real growth can be witnessed in the number of applications examined and patents granted.
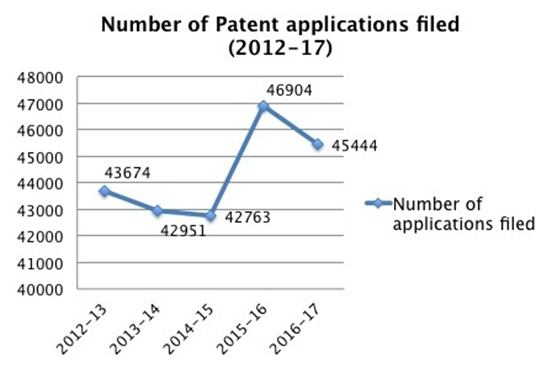
There has been a 136.1% increase in the number of applications filed in the Patent Office probably because of the drastic increase in the recruitment of Examiners by the Office. In 2016, the Department of Industrial Policy and Promotion (“DIPP”)recruited 458 patent examiners. From 12,268 applications examined in 2012-13, the numbers went up to 28,967 in 2016-17.

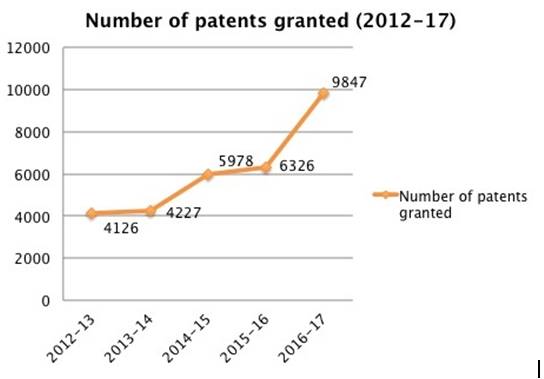
The increase in examination also came with an increase in the number of patents granted. The granting of patents witnessed a growth of 138.6% from 2012 to 2017. In 2012, the number of patents granted was 4,126 while in 2016-17, 9,847 patents were granted.
ii. Fields Of Inventions In Which Patents Granted
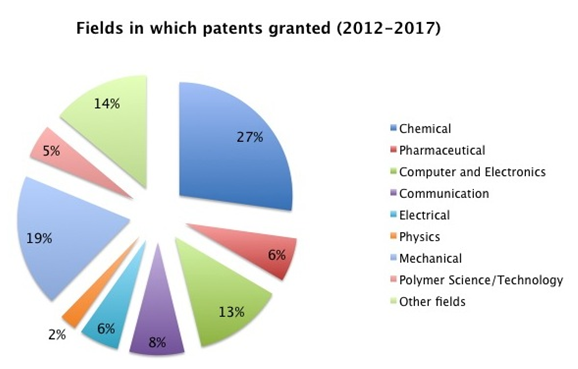
Consistently, the chemical field has had the largest share in the number of patents granted from 2012-2017 while fields such as bio-medical and agriculture engineering have had negligible shares (and thus clubbed together with other fields).
iii. Pendency Time In India
The World Intellectual Property Indicators 2017 Report by the World Intellectual Property Organisation analyzed the pendency time across different patent offices in the world. The pendency time for first office action was calculated as the average time in months from request for examination to the first office action. If there is no requirement for applicants to request examination, it was calculated from the filing date to the date of the first office action.
The pendency time for the final office decision was calculated as the average time (months) from request for examination to final decision. If there is no requirement for applicants to request an examination, it was calculated from the filing date to the date of the decision.
The pendency time for first office action was shortest in New Zealand (1.3 months), while India had one of the longest pendency times with 72 months. Pendency time for final decision was shortest in the Islamic Republic of Iran (9 months) while India had an average of 84 months.
iv. Top Applicants And Patentees
The Patent Office considers all Indian Institutes of Technology collectively in its Annual Reports. IIT (collectively) has dominated patent filing activity with the latest figures of 2016-17 showing 400 applications filed by the entity. Among foreign resident applications, Qualcomm has remained the top-most since 2012-13, with the 1840 applications filed by the company in 2016-17.
However, the top Indian patentee has been the Council of Scientific and Industrial Research from 2012-17, with 104 patents granted in 2016-17. Amongst the foreign resident patentees, there has been a close competition between Qualcomm and GM Global Technology Operations through the years. In 2016-17, Qualcomm had the most patents granted, that is, 383.
Conclusion
Despite the increase in the number of Examiners and patents granted, there is still a lot of work to be done in the area of time management by the Patent Office. The increase in the number of Examiners is a welcome step to ease the burden but, efficiency is also required along with quantity. With respect to patents granted, the previous years (2012-2016) had an average of 5,164 patents granted but the figures from 2016-17 have pushed the average to 6,100. Since there was sudden drastic growth in the number of patents granted in 2016-17, it is too soon to say what the trend is going to be like. However, DIPP’s mass recruitments will ensure that an increasing number of applications are examined every year. Hopefully, India will soon be at par with major patent offices such as China, Japan, and the United States.
Author: Aparajita Kaul, Intern at IP and Legal Filings, and can be reached at support@ipandlegalfilings.com.